00:00
/
00:00
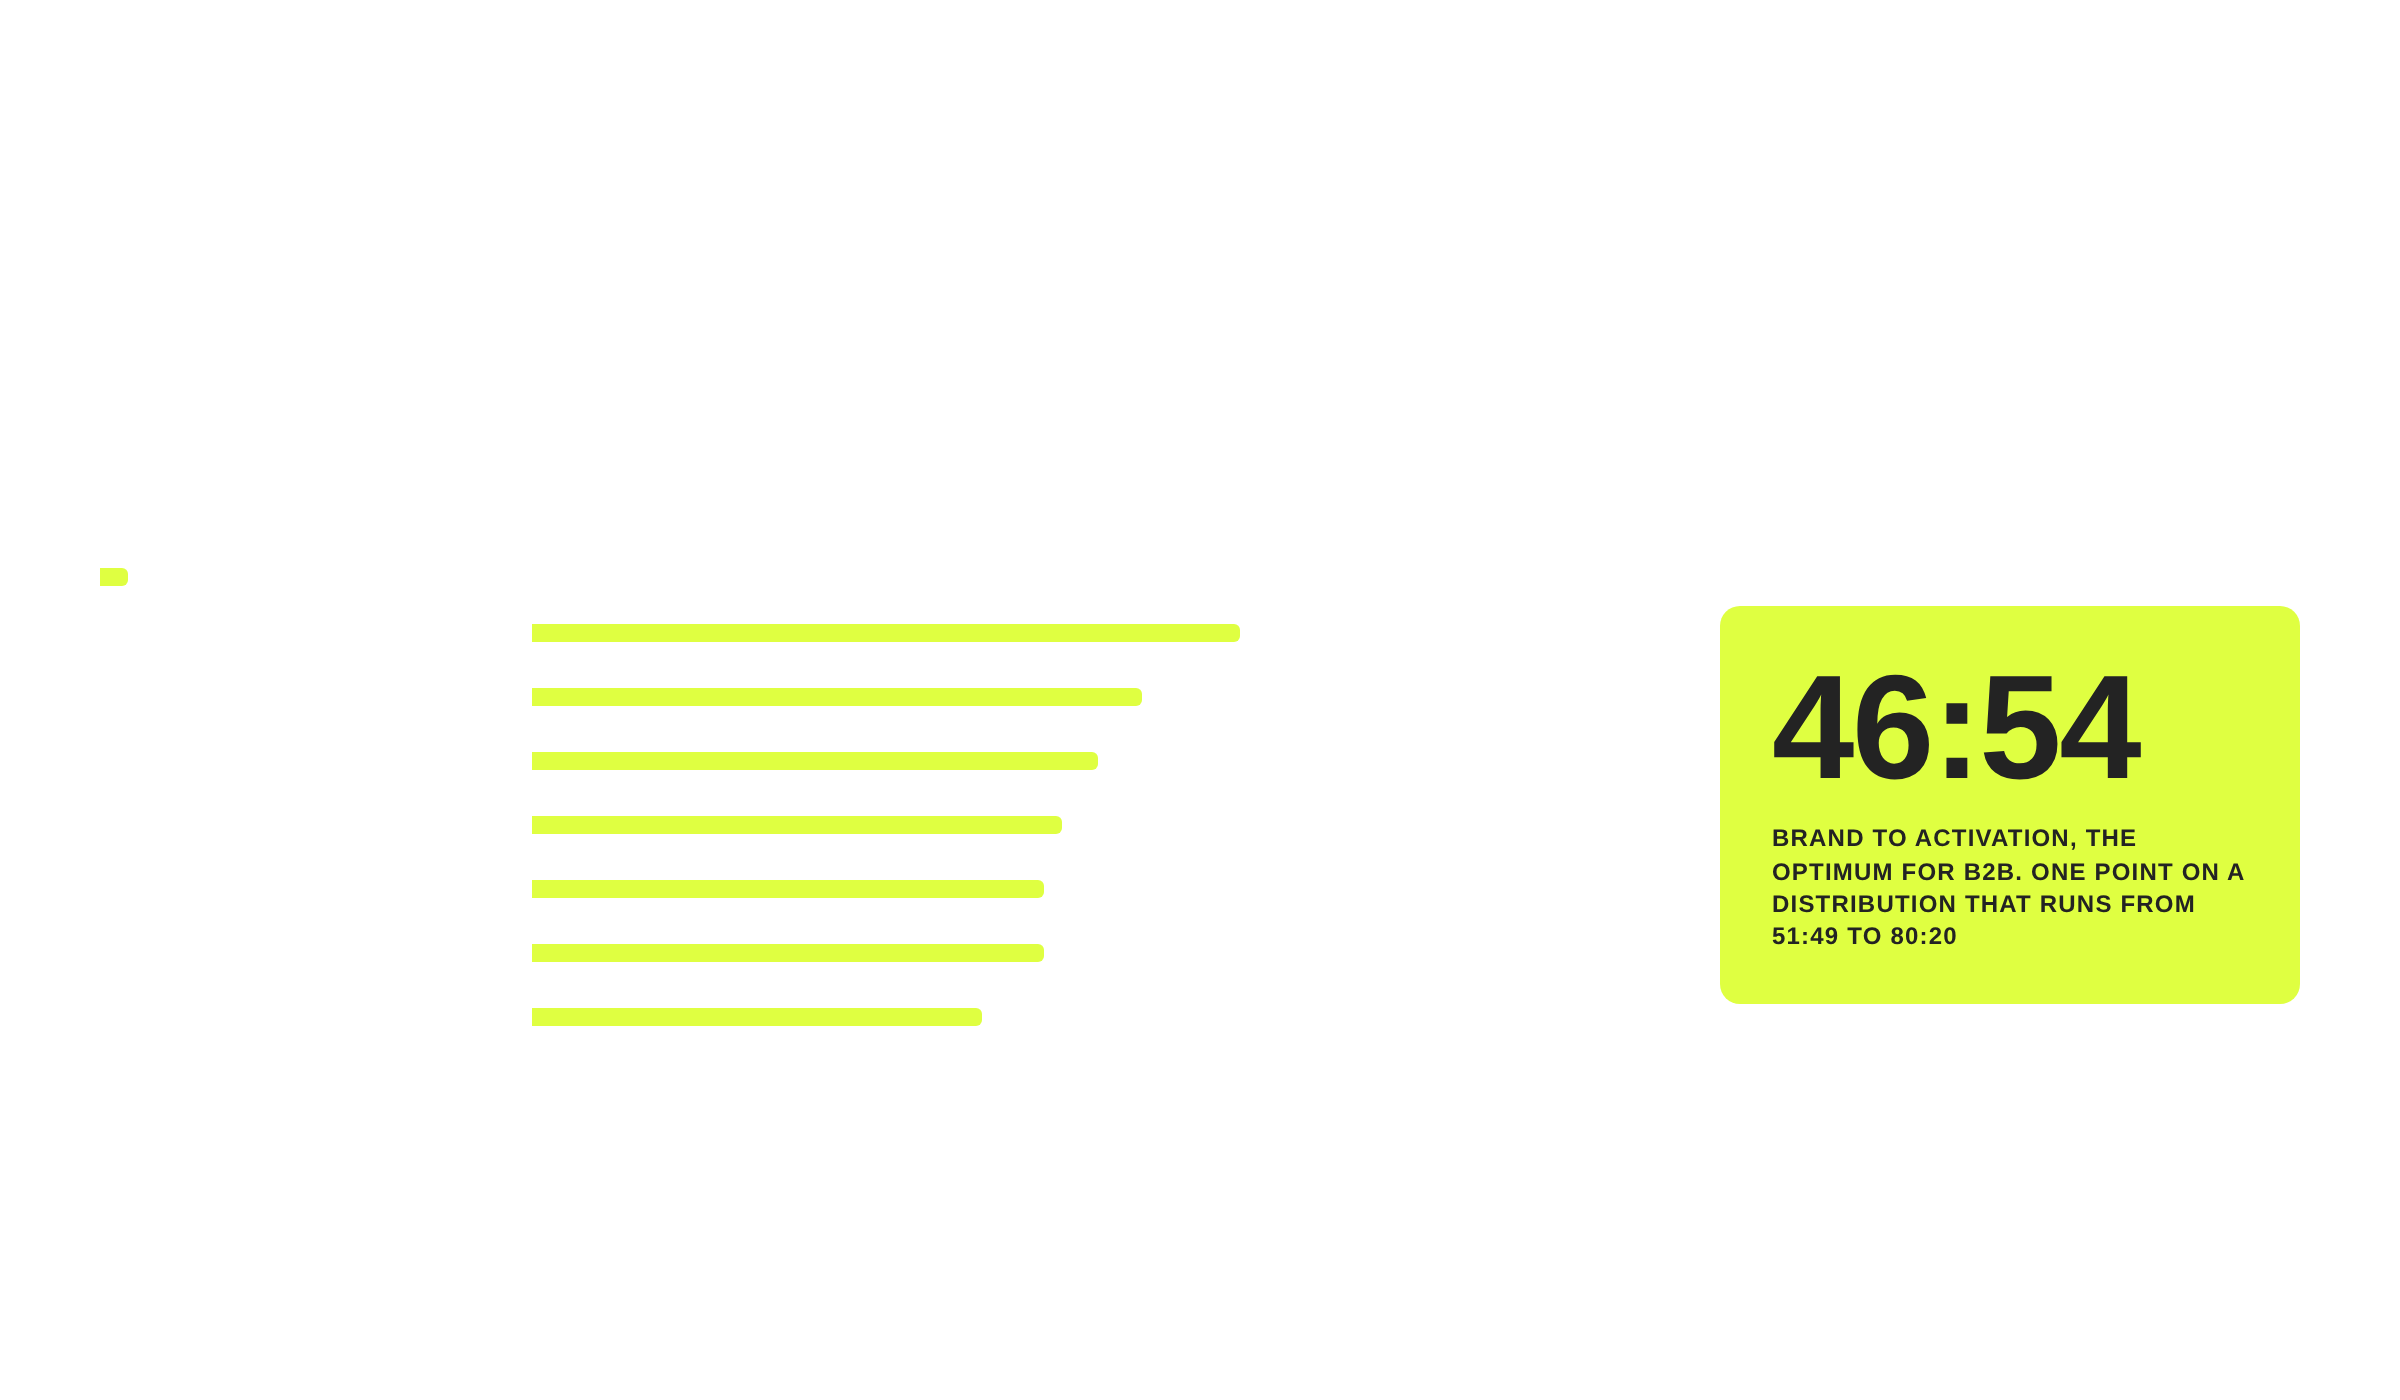
The split between brand building and sales activation in B2B marketing is a research finding, not a matter of taste. The optimum sits at roughly 46% brand and 54% activation, and most companies are nowhere near it. So what are the two halves of that budget actually buying?
How much of a B2B marketing budget should go to brand
Binet and Field's B2B research for the LinkedIn B2B Institute puts the optimal balance at approximately 46% brand building and 54% sales activation. That is the number to plan against in B2B. Source: Les Binet and Peter Field, The 5 Principles of Growth in B2B Marketing: Empirical Observations on B2B Effectiveness, The B2B Institute, 2019, Principle 2.
It is close to an even split, which surprises people in both directions, and it is the single number that does most to shape a plan built for how to compete when competitors outspend you. Marketers who assume brand work is a luxury are budgeting far below it. Marketers who have read the general-market research are often working from a higher brand share, because the cross-category figure is different and B2B is one of the categories that moves it.
In B2B the brand half of the budget is not the discretionary half. It is close to half the budget.
Why the brand half and the activation half do different jobs
The split exists because the two kinds of advertising work on different timescales and produce different effects.
Sales activation is persuasive and short. It finds people who are close to a decision and moves them over the line, and the revenue shows up inside the quarter. Brand building is emotional and slow. It creates familiarity among people who are not deciding anything yet, and the return arrives later and lasts longer.
The evidence for the emotional half is unambiguous. Emotional campaigns produce stronger long-term business effects than rational ones, and a higher share of them report very large profit growth. Source: Les Binet and Peter Field, The Long and the Short of It, IPA, figures 44 and 53.
Spend everything on activation and you will raise revenue per quarter and stop growing. Spend everything on brand and you will have a well-regarded business with a weak pipeline. The recommendation attached to the original research is to put 50 to 60% of the budget behind creative, emotional, brand-based messaging in the general case. Source: Les Binet and Peter Field, The Long and the Short of It, IPA, figures 2 and 38.
Why there is no single correct split across categories
The reason B2B gets its own figure is that the optimum is not universal. The IPA's own sector data shows it moving substantially by category.
Across seven sectors, the optimal top-of-funnel to bottom-of-funnel balance runs from 51:49 to 80:20.
- Financial services: 80:20
- Durables, non-automotive: 69:31
- Retail: 64:36
- Fast-moving consumer goods: 60:40
- Durables: 58:42
- Telco and internet service providers: 58:42
- Other services: 51:49
Source: Effectiveness in Context, IPA Databank of 497 for-profit and 121 not-for-profit cases submitted between 1998 and 2016, The Institute of Practitioners in Advertising UK.
A twenty-nine point spread between the top and bottom of that list is not measurement error. It means any single headline number, including the widely quoted 60:40 cross-category average, is the midpoint of a wide distribution rather than an instruction. The B2B figure is one point on that distribution.
How far most companies sit from their optimum
The same data reports what companies actually spend beside what they should spend, and the gaps are large.
- Financial services should sit at 80:20 and sits at 54:26, the widest gap in the set.
- Non-automotive durables should sit at 69:31 and sits at 49:51, roughly inverted.
- Retail should sit at 64:36 and sits at 51:49.
- Fast-moving consumer goods should sit at 60:40 and sits at 71:29, overweight on brand rather than under.
- Other services should sit at 51:49 and sits at 57:43.
- Durables and telco both sit close to their optimum, at 56:44 against 58:42.
Two sectors are close. Most are not, and the direction of the error is usually the same: less brand investment than the evidence supports. Fast-moving consumer goods is the exception that proves the measurement is real, because it errs the other way.
Most categories are not slightly off their optimal marketing budget split. They are off by fifteen to twenty-six points.
What to do with the number
Treat 46:54 as the planning default for a B2B budget and then check it against your own position. A business with no familiarity in its category needs more of the brand half than one with an established name. A business sitting on a large pipeline and weak conversion needs less.
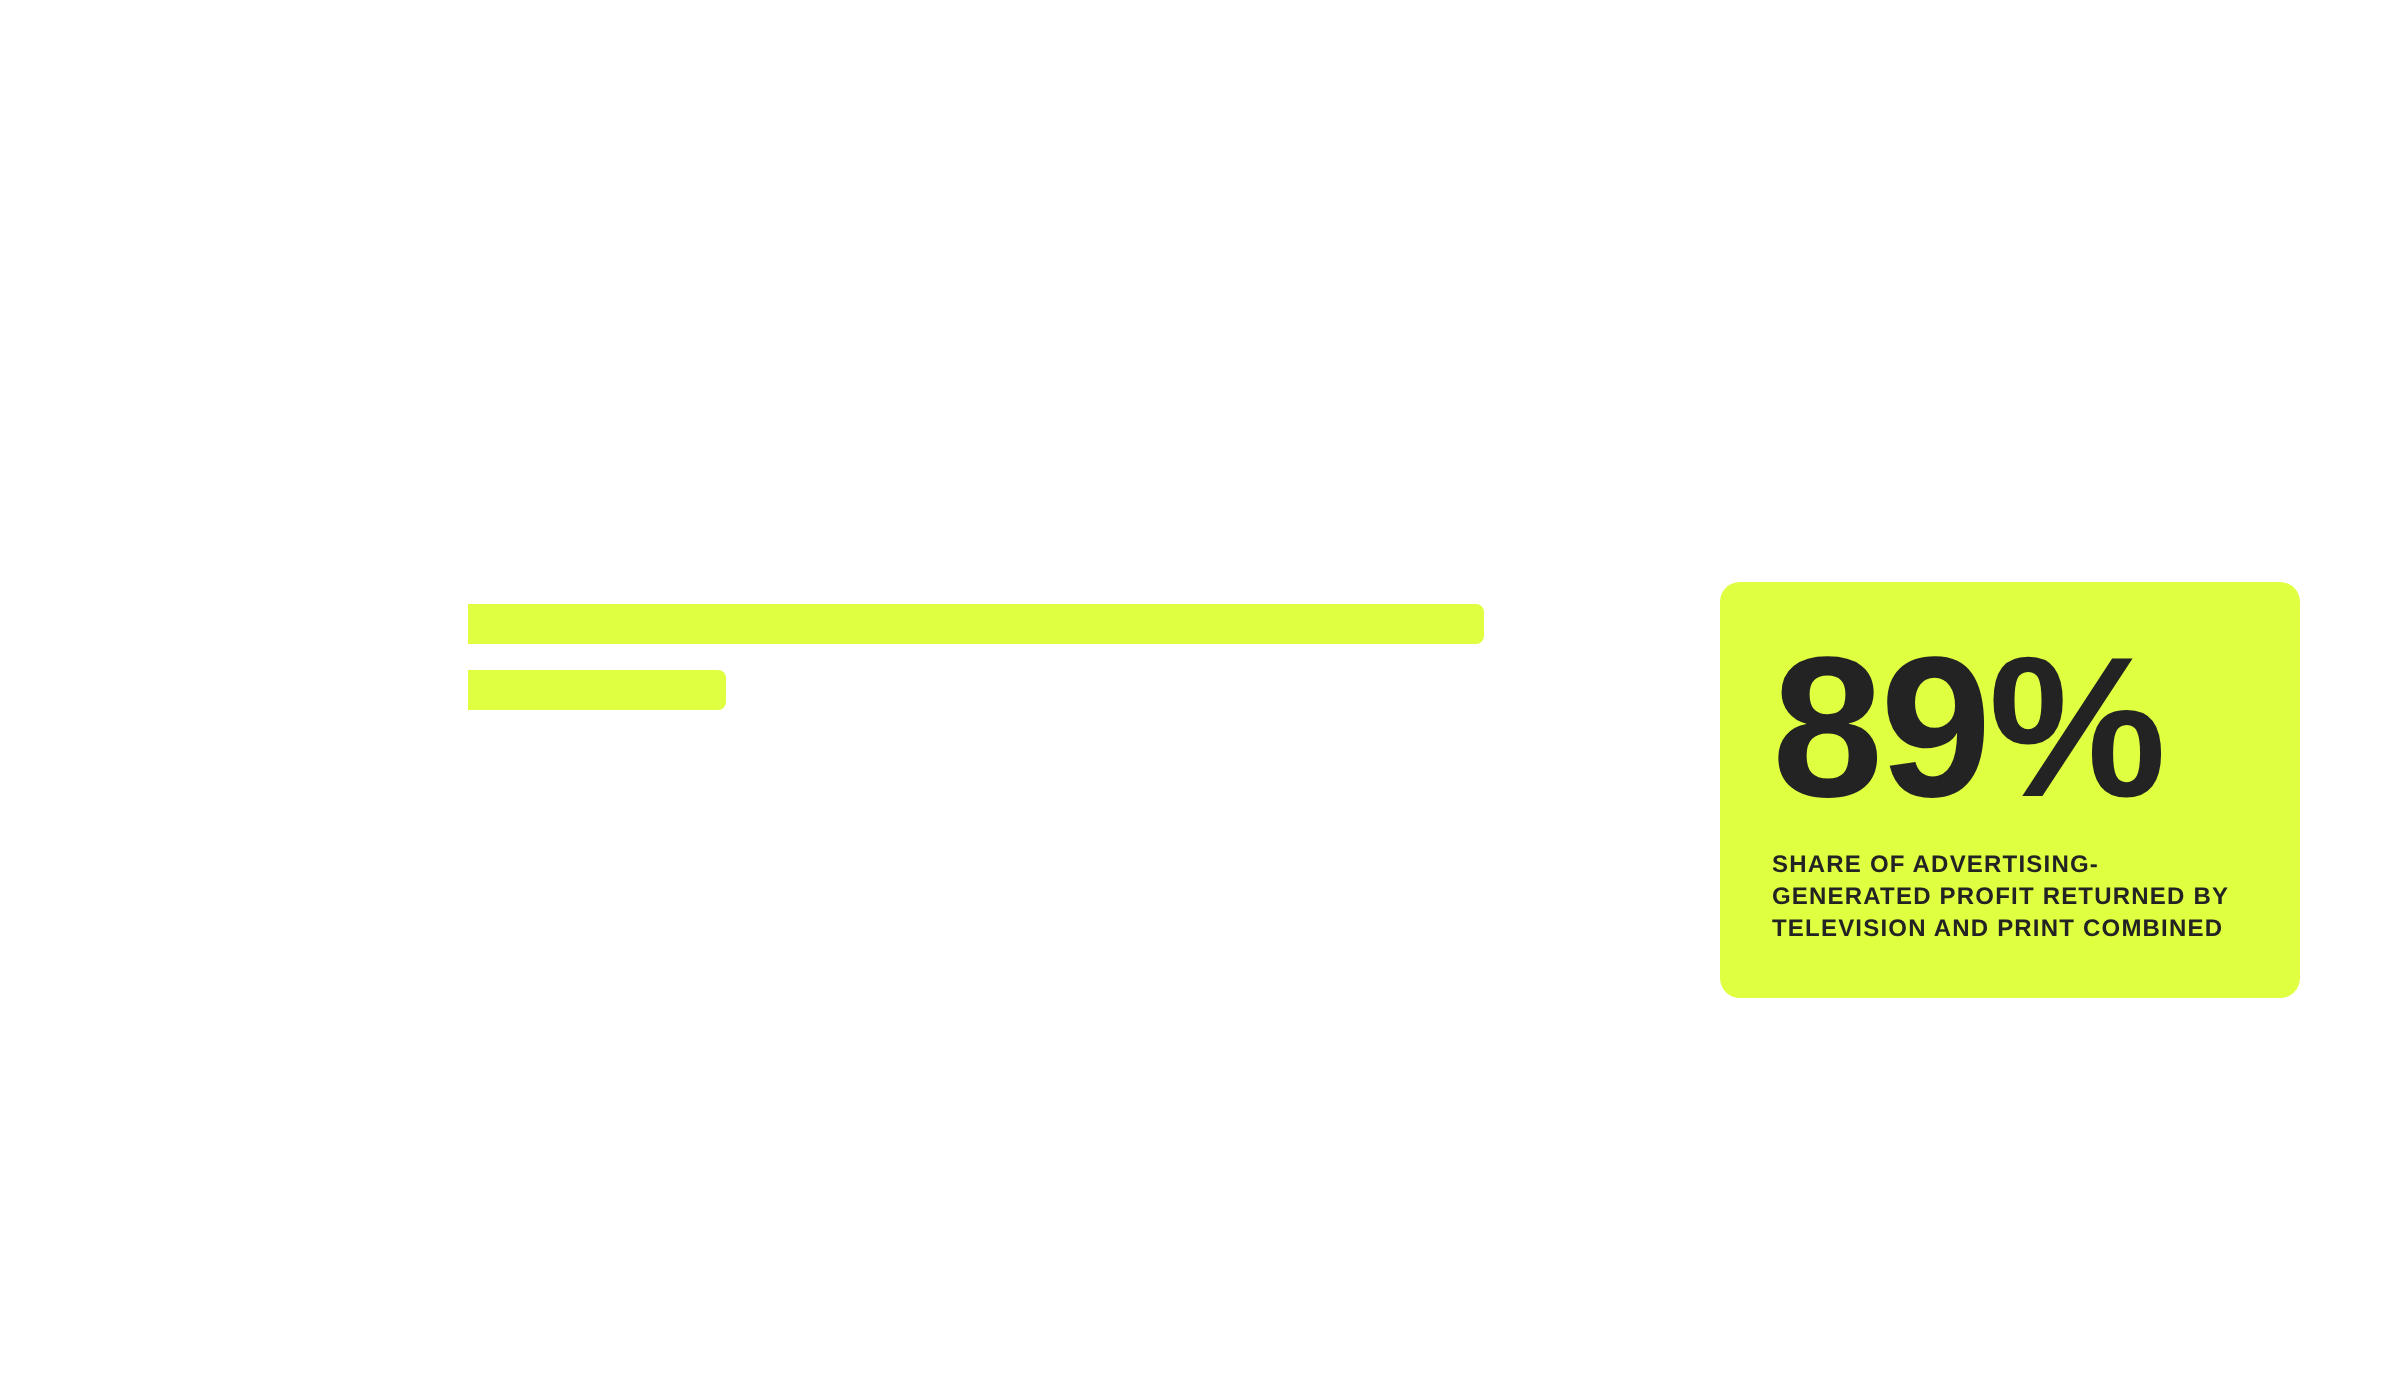
What the brand half buys, in media terms, is covered in TV and print deliver 89% of advertising profit. What happens to companies that run on the activation half alone is covered in short-term advertising broke campaign effectiveness.
This article draws on How to build a big brand on a small marketing budget, our report on cost-effective brand building.


Being outspent is a media problem before it is a brand problem. Your competitors are not smarter than you, they simply reach more of the market more often, and that advantage compounds quietly for years. Six decisions decide how far a smaller budget goes. So where does the money actually have to land?